

- Trang Nhà - HOME
- Trang Cộng Đồng
- Việt Cộng Bán Nước
- Trang Nạn Nhân CS
- Trang Quốc Nội
- Trang Thời sự
- Ký Kháng Thư,
Thỉnh Nguyện Thư
Cộng Đồng- Thời Sự
- VN History - Lịch sử
- Hoàng Sa - Trường Sa
- Em Học Vần VN
- Bài Tập Toán - Math
- Đồng Quê - Âm Nhạc
- Ảnh Nghệ Thuật
- Thơ - Văn - Ảnh BĐ
- Sức Khỏe - Health
- Trang Tôn Giáo
- Trang Gia Chánh
- Sưu Tầm - Kỹ Thuật
- Hỏi Đáp Kỹ Thuật
- Hỏi Đáp Pháp Luật
- Hỏi Đáp Y - Nha Khoa
- Đơn vị Đo Lường
- Tính tiền trả/tháng
- Lịch 2014
- Khối 8406
- Văn Bút VN Hải Ngoại
- Kỹ Thuật Vĩnh Long
Lịch Sử - Health - Art
Kỹ Thuật - Gia Chánh
- Trang Chúc mừng
- Trang Phân ưu
- Tìm Bạn - Thân Nhân
- Rao Vặt Miễn Phí
- Ý kiến - Liên Lạc
Liên Lạc - Linh Tinh
- Dư Thị Diễm Buồn
- Ðặng Văn Âu
- Gót Hồng
- Hai Rạch Dừa
- Hồ Công Tâm
- Hoa Hoàng Lan
- Hoa Hướng Dương
- Hoàng Lan
- Hoàng Xuyên Anh
- Hương Kiều Loan
- Hùng Biên
- Huyên Chương Quý
- Huỳnh Quốc Huy
- Kiêm Ái
- Lê Đình An
- Lê Thị Ảnh
- Lm NguyễnVănLý
- Lý Thảo Yên
- Mạnh Hoàng Quân
- Ngọc Danh
- Ngô Minh Hằng
- Nguyễn Chính Kết
- Nguyễn Hữu Nhân
- Nguyễn Ngọc Hạnh
- Nguyễn Quang Duy
- Nguyễn Thiếu Nhẫn
- Nguyễn Trung Tôn
- Nguyễn Văn Canh
- Nguyễn Văn Luận
- Nhất Hùng
- Ninh Thuận
- Phạm Bá Hoa
- Phạm Trần
- Phạm Văn Bản
- Quang Dương
- Thanh Hương
- Thích Viên Định
- Thúy Sơn
- Thích Nữ Chân Liễu
- Thích Chân Tuệ
- Trần Thanh Thiết
- Trần Long
- Trần Quốc Bảo
- Trang Y Hạ
- Vi Anh
- Võ Đại Tôn
- Võ Thạnh Văn
- Ý Nga
- ==*==
Bloggers - Bạn Đọc Viết


Math Exercises - Vietlist.US
Simple Statistics Review.
-------------oo0oo--------------
- Mean : Total of the values divided by the number of data points
- Median: The middle value in the list of numbers. To find the median, the numbers have to be listed in numerical order.
- Range: The difference between the largest and smallest values.
- Error : subtract the theoretical value from your experimental data point.
- Percent error: The absolute value of the error divided by the theoretical value, then multiply by 100.
- Deviation : subtract the mean from the experimental data point
- Percent deviation : divide the deviation by the mean, then multiply by 100.
| Mean = | ∑ data points | = | Total | |
| number of data points | n |
Median:
Test results: 1, 2, 5, 9, 11 --> Median = 5
Test results: 3, 4, 5, 6, 8, 10 --> Median = (5+6)/2 = 5.5
Range:
Test results: 1, 2, 3, 5, 8, 10 --> Range = 10 - 1 = 9
Error = Experimental value - 'true' or theoretical value
| Percent Error = | Error | x 100 | |
| Theoretical value |
Deviation = Experimental value - Mean
| Percent Deviation = | Deviation | x 100 | |
| Theoretical value |
Standard Deviation
Standard deviation (σ) is a particularly useful tool in helping to check the spreading of the data. The bell curve is the most common type of the distribution for a variable. One standard deviation, or one sigma, away from the mean in either direction on the horizontal axis accounts for around 68 percent of the data points. Two standard deviations, or two sigmas, away from the mean account for roughly 95 percent of the data points. Three standard deviations account for about 99 percent of the data points.| σ = | √ | ∑ d2 | |
| n - 1 | |||
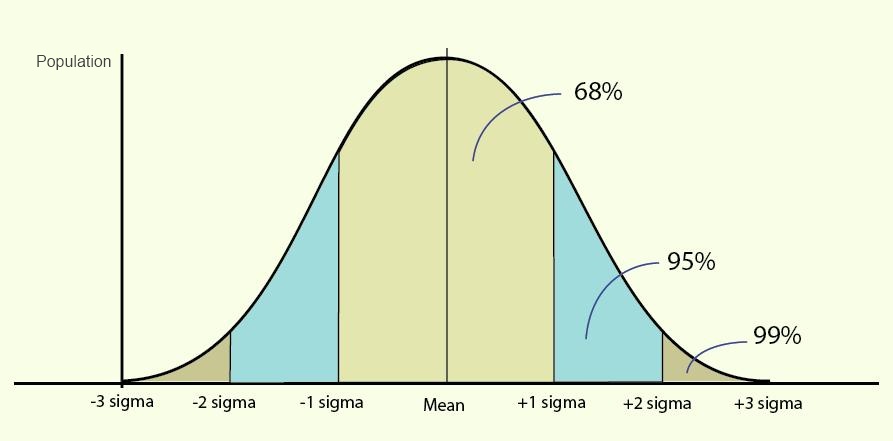
The Bell Curve
Calculation using the z-score method:
First calculate the z-score and then look up its corresponding p-value using the standard normal table.
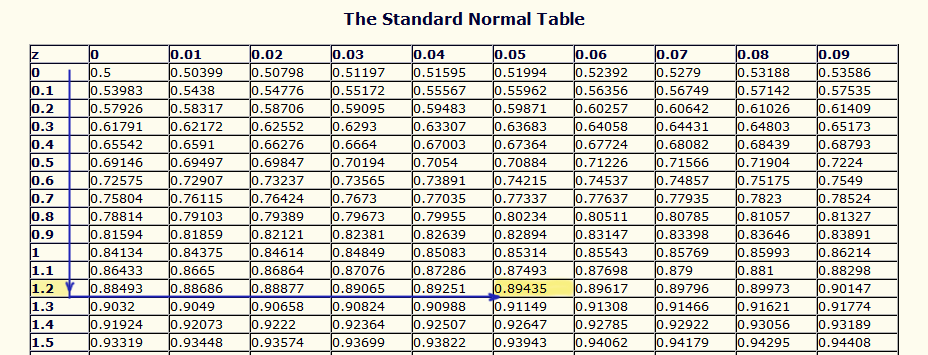
The Standard Normal Table
| z | 0 | 0.01 | 0.02 | 0.03 | 0.04 | 0.05 | 0.06 | 0.07 | 0.08 | 0.09 |
| 0 | 0.5 | 0.50399 | 0.50798 | 0.51197 | 0.51595 | 0.51994 | 0.52392 | 0.5279 | 0.53188 | 0.53586 |
| 0.1 | 0.53983 | 0.5438 | 0.54776 | 0.55172 | 0.55567 | 0.55962 | 0.56356 | 0.56749 | 0.57142 | 0.57535 |
| 0.2 | 0.57926 | 0.58317 | 0.58706 | 0.59095 | 0.59483 | 0.59871 | 0.60257 | 0.60642 | 0.61026 | 0.61409 |
| 0.3 | 0.61791 | 0.62172 | 0.62552 | 0.6293 | 0.63307 | 0.63683 | 0.64058 | 0.64431 | 0.64803 | 0.65173 |
| 0.4 | 0.65542 | 0.6591 | 0.66276 | 0.6664 | 0.67003 | 0.67364 | 0.67724 | 0.68082 | 0.68439 | 0.68793 |
| 0.5 | 0.69146 | 0.69497 | 0.69847 | 0.70194 | 0.7054 | 0.70884 | 0.71226 | 0.71566 | 0.71904 | 0.7224 |
| 0.6 | 0.72575 | 0.72907 | 0.73237 | 0.73565 | 0.73891 | 0.74215 | 0.74537 | 0.74857 | 0.75175 | 0.7549 |
| 0.7 | 0.75804 | 0.76115 | 0.76424 | 0.7673 | 0.77035 | 0.77337 | 0.77637 | 0.77935 | 0.7823 | 0.78524 |
| 0.8 | 0.78814 | 0.79103 | 0.79389 | 0.79673 | 0.79955 | 0.80234 | 0.80511 | 0.80785 | 0.81057 | 0.81327 |
| 0.9 | 0.81594 | 0.81859 | 0.82121 | 0.82381 | 0.82639 | 0.82894 | 0.83147 | 0.83398 | 0.83646 | 0.83891 |
| 1 | 0.84134 | 0.84375 | 0.84614 | 0.84849 | 0.85083 | 0.85314 | 0.85543 | 0.85769 | 0.85993 | 0.86214 |
| 1.1 | 0.86433 | 0.8665 | 0.86864 | 0.87076 | 0.87286 | 0.87493 | 0.87698 | 0.879 | 0.881 | 0.88298 |
| 1.2 | 0.88493 | 0.88686 | 0.88877 | 0.89065 | 0.89251 | 0.89435 | 0.89617 | 0.89796 | 0.89973 | 0.90147 |
| 1.3 | 0.9032 | 0.9049 | 0.90658 | 0.90824 | 0.90988 | 0.91149 | 0.91308 | 0.91466 | 0.91621 | 0.91774 |
| 1.4 | 0.91924 | 0.92073 | 0.9222 | 0.92364 | 0.92507 | 0.92647 | 0.92785 | 0.92922 | 0.93056 | 0.93189 |
| 1.5 | 0.93319 | 0.93448 | 0.93574 | 0.93699 | 0.93822 | 0.93943 | 0.94062 | 0.94179 | 0.94295 | 0.94408 |
| 1.6 | 0.9452 | 0.9463 | 0.94738 | 0.94845 | 0.9495 | 0.95053 | 0.95154 | 0.95254 | 0.95352 | 0.95449 |
| 1.7 | 0.95543 | 0.95637 | 0.95728 | 0.95818 | 0.95907 | 0.95994 | 0.9608 | 0.96164 | 0.96246 | 0.96327 |
| 1.8 | 0.96407 | 0.96485 | 0.96562 | 0.96638 | 0.96712 | 0.96784 | 0.96856 | 0.96926 | 0.96995 | 0.97062 |
| 1.9 | 0.97128 | 0.97193 | 0.97257 | 0.9732 | 0.97381 | 0.97441 | 0.975 | 0.97558 | 0.97615 | 0.9767 |
| 2 | 0.97725 | 0.97778 | 0.97831 | 0.97882 | 0.97932 | 0.97982 | 0.9803 | 0.98077 | 0.98124 | 0.98169 |
| 2.1 | 0.98214 | 0.98257 | 0.983 | 0.98341 | 0.98382 | 0.98422 | 0.98461 | 0.985 | 0.98537 | 0.98574 |
| 2.2 | 0.9861 | 0.98645 | 0.98679 | 0.98713 | 0.98745 | 0.98778 | 0.98809 | 0.9884 | 0.9887 | 0.98899 |
| 2.3 | 0.98928 | 0.98956 | 0.98983 | 0.9901 | 0.99036 | 0.99061 | 0.99086 | 0.99111 | 0.99134 | 0.99158 |
| 2.4 | 0.9918 | 0.99202 | 0.99224 | 0.99245 | 0.99266 | 0.99286 | 0.99305 | 0.99324 | 0.99343 | 0.99361 |
| 2.5 | 0.99379 | 0.99396 | 0.99413 | 0.9943 | 0.99446 | 0.99461 | 0.99477 | 0.99492 | 0.99506 | 0.9952 |
| 2.6 | 0.99534 | 0.99547 | 0.9956 | 0.99573 | 0.99585 | 0.99598 | 0.99609 | 0.99621 | 0.99632 | 0.99643 |
| 2.7 | 0.99653 | 0.99664 | 0.99674 | 0.99683 | 0.99693 | 0.99702 | 0.99711 | 0.9972 | 0.99728 | 0.99736 |
| 2.8 | 0.99744 | 0.99752 | 0.9976 | 0.99767 | 0.99774 | 0.99781 | 0.99788 | 0.99795 | 0.99801 | 0.99807 |
| 2.9 | 0.99813 | 0.99819 | 0.99825 | 0.99831 | 0.99836 | 0.99841 | 0.99846 | 0.99851 | 0.99856 | 0.99861 |
| 3 | 0.99865 | 0.99869 | 0.99874 | 0.99878 | 0.99882 | 0.99886 | 0.99889 | 0.99893 | 0.99896 | 0.999 |
| 3.1 | 0.99903 | 0.99906 | 0.9991 | 0.99913 | 0.99916 | 0.99918 | 0.99921 | 0.99924 | 0.99926 | 0.99929 |
| 3.2 | 0.99931 | 0.99934 | 0.99936 | 0.99938 | 0.9994 | 0.99942 | 0.99944 | 0.99946 | 0.99948 | 0.9995 |
| 3.3 | 0.99952 | 0.99953 | 0.99955 | 0.99957 | 0.99958 | 0.9996 | 0.99961 | 0.99962 | 0.99964 | 0.99965 |
| 3.4 | 0.99966 | 0.99968 | 0.99969 | 0.9997 | 0.99971 | 0.99972 | 0.99973 | 0.99974 | 0.99975 | 0.99976 |
| 3.5 | 0.99977 | 0.99978 | 0.99978 | 0.99979 | 0.9998 | 0.99981 | 0.99981 | 0.99982 | 0.99983 | 0.99983 |
| 3.6 | 0.99984 | 0.99985 | 0.99985 | 0.99986 | 0.99986 | 0.99987 | 0.99987 | 0.99988 | 0.99988 | 0.99989 |
| 3.7 | 0.99989 | 0.9999 | 0.9999 | 0.9999 | 0.99991 | 0.99991 | 0.99992 | 0.99992 | 0.99992 | 0.99992 |
| 3.8 | 0.99993 | 0.99993 | 0.99993 | 0.99994 | 0.99994 | 0.99994 | 0.99994 | 0.99995 | 0.99995 | 0.99995 |
| 3.9 | 0.99995 | 0.99995 | 0.99996 | 0.99996 | 0.99996 | 0.99996 | 0.99996 | 0.99996 | 0.99997 | 0.99997 |
| 4 | 0.99997 | 0.99997 | 0.99997 | 0.99997 | 0.99997 | 0.99997 | 0.99998 | 0.99998 | 0.99998 | 0.99998 |
Example of calculation using the z-score method:
If the z-score = 1.25. Follow the rows down to 1.2 and then across the columns to 0.05. The P-value is the highlighted box with a value of 0.89435. Values in the table represent area under the standard normal distribution curve to the left of the z-score.
Using the previous example:
Z-score = 1.25, P-value = 0.89435 = 89.435% is graphically represented below.
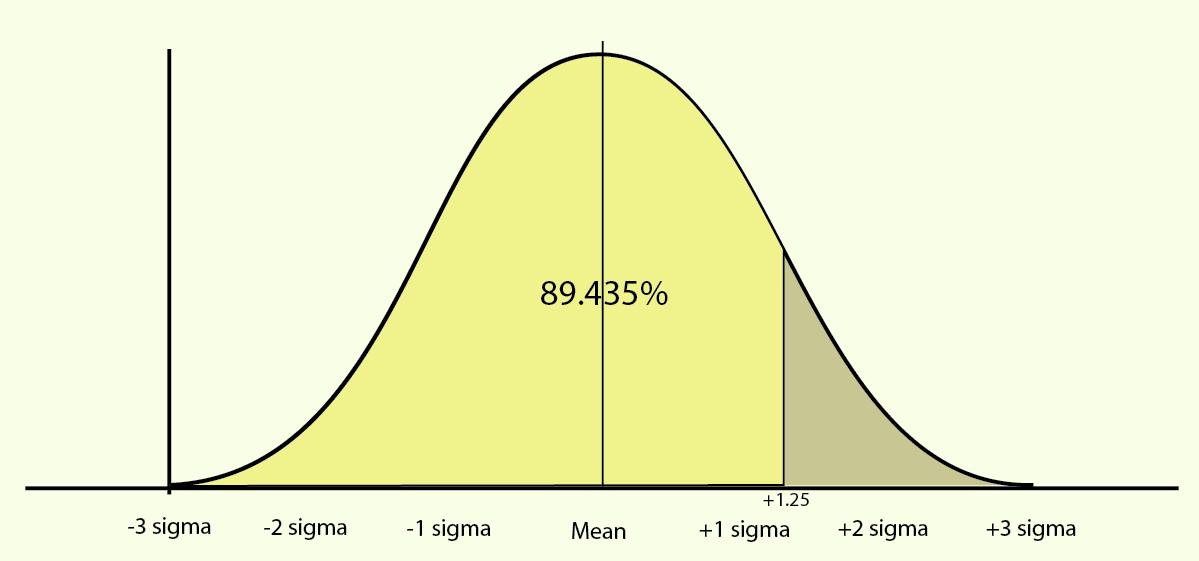
The area of 89.435% is corresponding to z = 1.25. Remember that the area starts from 0 to the point of 1.25 sigma.
-------------oo0oo---------------
Những hình ảnh đẹp của Cộng Đồng Việt Nam

Lá cờ vàng Việt Nam được chính quyền địa phương vinh danh và luôn được đồng bào trân trọng trong mọi lễ hội


Visistors: 350427
